Electrify Chicago
According to the
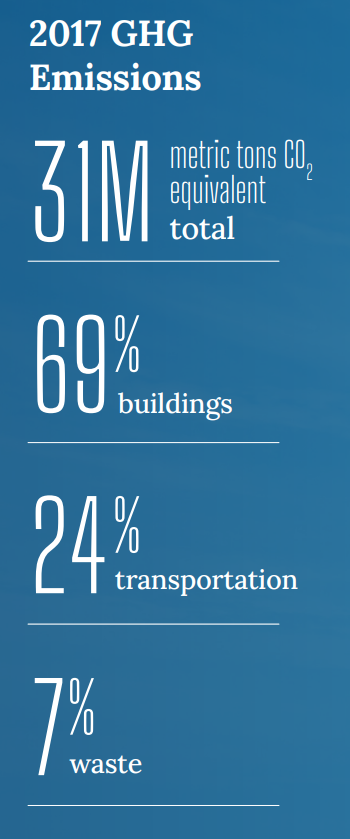
2022 Chicago Climate Action Plan ,
a whopping 69% of Chicago's emissions come from buildings, making it
our biggest challenge and our biggest opportunity as a city to tackle
change. At Electrify Chicago we want to showcase some of the best and worst performing
buildings in the city using publicly available data and manual annotations to add
building photographs and label multi-building owners like universities.
,
a whopping 69% of Chicago's emissions come from buildings, making it
our biggest challenge and our biggest opportunity as a city to tackle
change. At Electrify Chicago we want to showcase some of the best and worst performing
buildings in the city using publicly available data and manual annotations to add
building photographs and label multi-building owners like universities.
You can start by looking at Chicago's buildings with the highest greenhouse gas intensity - this means that they use the most energy when adjusted per unit of square foot, so big buildings could actually perform much better than very inefficient small buildings on this metric.
Chicago Buildings by Greenhouse Gas Intensity
Note: Data only includes large Chicago buildings from 2021, unless explicitly stated otherwise.
Note: This data only includes buildings whose emissions are reported
under the
Chicago Energy Benchmarking Ordinance. According to the City “As of 2016,
this list includes all commercial, institutional, and residential buildings larger than
50,000 square feet.” This dataset is also then filtered to only buildings with
reported emissions > 1,000 metric tons CO2 equivalent.
This data is also from 2021, but when new benchmark data is available, we'll update the site.
| Property Name / address | Primary Property Type |
Greenhouse Gas Intensity (kg CO2 eq./sqft) |
Total Greenhouse Emissions (metric tons CO2 eq.) |
|---|---|---|---|
|
FM Property LLC
833 857 W FULTON MARKET
| Multifamily Housing | 18.1 kg/sqft
Highest 5%
| 1,061 tons
Highest 43%
|
|
Clark Manor
7427 7433 N CLARK ST
| Senior Living Community | 18.1 kg/sqft
Highest 5%
| 1,064 tons
Highest 43%
|
|
University Club of Chicago
76 E Monroe St
| Hotel | 18.1 kg/sqft
Highest 5%
| 2,604 tons
Highest 16%
|
|
Alden Lakeland Rehabilitation & Health Care Center
820 W LAWRENCE AVE
| Senior Living Community | 17.9 kg/sqft
Highest 5%
| 1,601 tons
Highest 29%
|
|
Galter Life Center
5157 N Francisco Ave
| Outpatient Rehabilitation/Physical Therapy | 17.8 kg/sqft
Highest 5%
| 1,281 tons
Highest 37%
|
|
Chevy Chase Nursing Ctr Inc
3400 3428 S INDIANA AVE
| Senior Living Community | 17.6 kg/sqft
Highest 5%
| 1,282 tons
Highest 37%
|
|
California Gardens
2829 S CALIFORNIA BLVD
| Senior Living Community | 17.6 kg/sqft
Highest 5%
| 1,280 tons
Highest 37%
|
|
8602
(Northwestern)
710 N Lakeshore Dr
| College/University | 17.6 kg/sqft
Highest 5%
| 4,153 tons
Highest 9%
|
|
Grand Ohio Condo
🚨
211 E Ohio St
| Multifamily Housing | 17.5 kg/sqft
Highest 5%
| 9,960 tons
Highest 2%
|
|
Midtown Athletic Club
2020 W Fullerton Ave
| Fitness Center/Health Club/Gym | 17.2 kg/sqft
Highest 5%
| 3,585 tons
Highest 11%
|
|
Block 37 (Retail)
108 North State Street
| Enclosed Mall | 17.1 kg/sqft
Highest 5%
| 7,331 tons
Highest 4%
|
|
United Airlines Reservation Center
11555 W Touhy Ave
| Office | 17.0 kg/sqft
Highest 5%
| 2,079 tons
Highest 22%
|
|
Garfield Park Behavioral Hospital
520 N Ridgeway Ave
| Other - Specialty Hospital | 17.0 kg/sqft
Highest 5%
| 910 tons
Highest 48%
|
|
Costco #1107 South Loop
1430 S Ashland Ave
| Supermarket/Grocery Store | 17.0 kg/sqft
Highest 5%
| 2,665 tons
Highest 16%
|
|
Chalet Living and Rehab
7350 7352 N SHERIDAN RD
| Senior Living Community | 16.9 kg/sqft
Highest 5%
| 1,136 tons
Highest 40%
|
Data Source:
Chicago Energy Benchmarking Data