Electrify Chicago
According to the
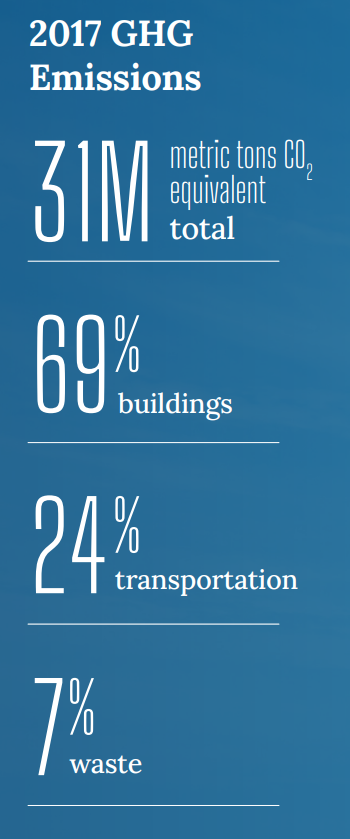
2022 Chicago Climate Action Plan ,
a whopping 69% of Chicago's emissions come from buildings, making it
our biggest challenge and our biggest opportunity as a city to tackle
change. At Electrify Chicago we want to showcase some of the best and worst performing
buildings in the city using publicly available data and manual annotations to add
building photographs and label multi-building owners like universities.
,
a whopping 69% of Chicago's emissions come from buildings, making it
our biggest challenge and our biggest opportunity as a city to tackle
change. At Electrify Chicago we want to showcase some of the best and worst performing
buildings in the city using publicly available data and manual annotations to add
building photographs and label multi-building owners like universities.
You can start by looking at Chicago's buildings with the highest greenhouse gas intensity - this means that they use the most energy when adjusted per unit of square foot, so big buildings could actually perform much better than very inefficient small buildings on this metric.
Chicago Buildings by Greenhouse Gas Intensity
Note: Data only includes large Chicago buildings from 2021, unless explicitly stated otherwise.
Note: This data only includes buildings whose emissions are reported
under the
Chicago Energy Benchmarking Ordinance. According to the City “As of 2016,
this list includes all commercial, institutional, and residential buildings larger than
50,000 square feet.” This dataset is also then filtered to only buildings with
reported emissions > 1,000 metric tons CO2 equivalent.
This data is also from 2021, but when new benchmark data is available, we'll update the site.
| Property Name / address | Primary Property Type |
Greenhouse Gas Intensity (kg CO2 eq./sqft) |
Total Greenhouse Emissions (metric tons CO2 eq.) |
|---|---|---|---|
|
70800552 -- Chicago
🚩
7030 S Ashland Ave
| Supermarket/Grocery Store | 28.5 kg/sqft #31 Highest
| 1,804 tons
Highest 26%
|
|
00187- Chicago, IL
🚩
11730 S Marshfield Ave
| Supermarket/Grocery Store | 28.2 kg/sqft #32 Highest
| 1,737 tons
Highest 27%
|
|
53100515--CHICAGO
🚩
1800 W LAWRENCE AVE
| Supermarket/Grocery Store | 27.9 kg/sqft #33 Highest
| 2,245 tons
Highest 19%
|
|
53100522--CHICAGO
🚩
5201 Sheridan Rd
| Supermarket/Grocery Store | 27.8 kg/sqft #34 Highest
| 1,533 tons
Highest 31%
|
|
Pete's Kedgie
🚩
4700 S Kedzie Ave
| Supermarket/Grocery Store | 27.7 kg/sqft #35 Highest
| 1,495 tons
Highest 31%
|
|
03470- Chicago, IL
🚩
3570 N Elston Ave
| Supermarket/Grocery Store | 27.3 kg/sqft #36 Highest
| 1,501 tons
Highest 31%
|
|
Whole Foods LVW
🚩
3201 N ASHLAND AVE
| Supermarket/Grocery Store | 27.0 kg/sqft #38 Highest
| 2,216 tons
Highest 20%
|
|
70800567 -- North and Cisero
🚩
4821 - 4951 W North Ave
| Supermarket/Grocery Store | 27.0 kg/sqft #38 Highest
| 1,568 tons
Highest 30%
|
|
03721- Chicago, IL
🚩
6107 S Archer Ave
| Supermarket/Grocery Store | 27.0 kg/sqft #38 Highest
| 1,352 tons
Highest 35%
|
|
Jones Laboratory
🚩
(UChicago)
5747 S Ellis Ave
| Laboratory | 26.9 kg/sqft #40 Highest
| 1,945 tons
Highest 24%
|
|
Roscoe Square/ 90034
🚩
3330 N Western Ave
| Supermarket/Grocery Store | 26.7 kg/sqft #41 Highest
| 1,372 tons
Highest 34%
|
|
03538- Chicago, IL
🚩
1763 W Howard St
| Supermarket/Grocery Store | 26.5 kg/sqft #42 Highest
| 1,864 tons
Highest 25%
|
|
Lurie Children's Lincoln Park Outpatient Center - Deming
🚩
467 W Deming Pl
| Mixed Use Property | 26.4 kg/sqft #43 Highest
| 1,663 tons
Highest 28%
|
|
600 North Michigan Avenue
🚩
600 N MICHIGAN AVE
| Retail Store | 26.3 kg/sqft #45 Highest
| 5,513 tons
Highest 6%
|
|
Stroger Hospital Campus
🚨
1901 W Harrison St
| Hospital (General Medical & Surgical) | 26.3 kg/sqft #45 Highest
| 41,988 tons #6 Highest
|
Data Source:
Chicago Energy Benchmarking Data