Electrify Chicago
According to the
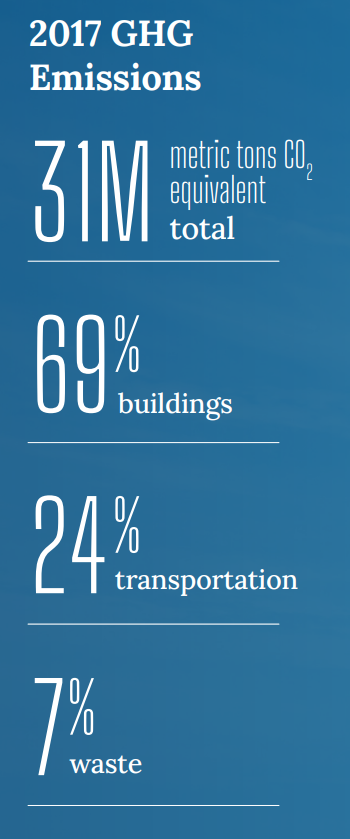
2022 Chicago Climate Action Plan ,
a whopping 69% of Chicago's emissions come from buildings, making it
our biggest challenge and our biggest opportunity as a city to tackle
change. At Electrify Chicago we want to showcase some of the best and worst performing
buildings in the city using publicly available data and manual annotations to add
building photographs and label multi-building owners like universities.
,
a whopping 69% of Chicago's emissions come from buildings, making it
our biggest challenge and our biggest opportunity as a city to tackle
change. At Electrify Chicago we want to showcase some of the best and worst performing
buildings in the city using publicly available data and manual annotations to add
building photographs and label multi-building owners like universities.
You can start by looking at Chicago's buildings with the highest greenhouse gas intensity - this means that they use the most energy when adjusted per unit of square foot, so big buildings could actually perform much better than very inefficient small buildings on this metric.
Chicago Buildings by Greenhouse Gas Intensity
Note: Data only includes large Chicago buildings from 2021, unless explicitly stated otherwise.
Note: This data only includes buildings whose emissions are reported
under the
Chicago Energy Benchmarking Ordinance. According to the City “As of 2016,
this list includes all commercial, institutional, and residential buildings larger than
50,000 square feet.” This dataset is also then filtered to only buildings with
reported emissions > 1,000 metric tons CO2 equivalent.
This data is also from 2021, but when new benchmark data is available, we'll update the site.
| Property Name / address | Primary Property Type |
Greenhouse Gas Intensity (kg CO2 eq./sqft) |
Total Greenhouse Emissions (metric tons CO2 eq.) |
|---|---|---|---|
|
The Belden (tb28)
2300 N Lincoln Park West
| Multifamily Housing | 3.0 kg/sqft
Lowest 3%
| 812 tons
Lowest 47%
|
|
Hawthorne Point
1511-1525 W Cullom Ave
| Multifamily Housing | 2.9 kg/sqft
Lowest 3%
| 162 tons
Lowest 1%
|
|
900-10 W Winona
🏆
900-10 W Winona Street
| Multifamily Housing | 2.9 kg/sqft
Lowest 3%
| 148 tons
#22 Lowest in Chicago*
|
|
Oakwood Court
6547 N Harlem Avenue
| Multifamily Housing | 2.9 kg/sqft
Lowest 3%
| 326 tons
Lowest 11%
|
|
The Strand
6321 S Cottage Grove Ave
| Multifamily Housing | 2.9 kg/sqft
Lowest 3%
| 254 tons
Lowest 5%
|
|
3033 Sheridan Tower Condominium Association
3033 N Sheridan Rd
| Multifamily Housing | 2.9 kg/sqft
Lowest 3%
| 808 tons
Lowest 47%
|
|
1369 E Hyde Park Blvd
1369 E HYDE PARK BLVD
| Multifamily Housing | 2.9 kg/sqft
Lowest 3%
| 198 tons
Lowest 2%
|
|
OAKWOOD CHICAGO RIVER NORTH
220 W Illinois St
| Multifamily Housing | 2.9 kg/sqft
Lowest 3%
| 483 tons
Lowest 26%
|
|
1606 1624 W Granville Ave / 6200 6248 N Clark St / 1605 1623 Thome Ave
6200 6248 N CLARK ST
| Multifamily Housing | 2.9 kg/sqft
Lowest 3%
| 588 tons
Lowest 34%
|
|
Kane Family Limited Partnership c/o Realty Mortgage Co. (346 N. Justine St.)
346 N Justine St
| Office | 2.9 kg/sqft
Lowest 3%
| 262 tons
Lowest 6%
|
|
La Plaza Hubbard 1812, LLC
1812 - 1840 W Hubbard St
| Mixed Use Property | 2.8 kg/sqft
Lowest 3%
| 340 tons
Lowest 12%
|
|
OurLadyofVictory_School
🏆
5212 W Agatite
| K-12 School | 2.8 kg/sqft
Lowest 3%
| 172 tons
Lowest 2%
|
|
James N Thorp Elementary School
8914 S Buffalo Ave
| K-12 School | 2.8 kg/sqft
Lowest 3%
| 386 tons
Lowest 17%
|
|
954 W Washington Blvd
954 W Washington Blvd
| Office | 2.8 kg/sqft
Lowest 3%
| 386 tons
Lowest 16%
|
|
Irving Park Terrace Condo Association
7707 W IRVING PARK RD
| Multifamily Housing | 2.8 kg/sqft
Lowest 3%
| 223 tons
Lowest 4%
|
Data Source:
Chicago Energy Benchmarking Data