Electrify Chicago
According to the
2022 Chicago Climate Action Plan ,
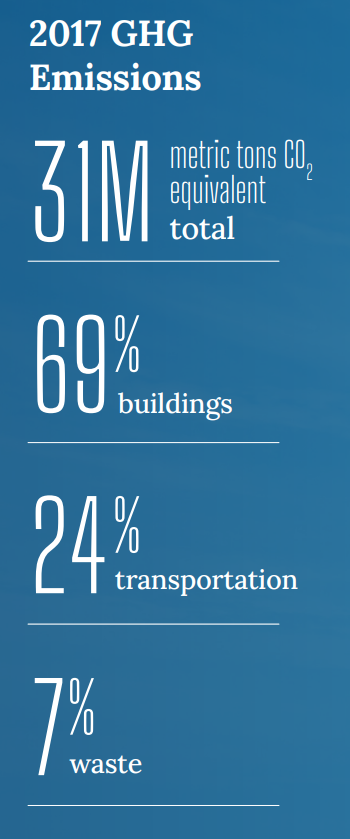
a whopping 69% of Chicago's emissions come from buildings, making it
our biggest challenge and our biggest opportunity as a city to tackle
change. At Electrify Chicago we want to showcase some of the best and worst performing
buildings in the city using publicly available data and manual annotations to add
building photographs and label multi-building owners like universities.
,
a whopping 69% of Chicago's emissions come from buildings, making it
our biggest challenge and our biggest opportunity as a city to tackle
change. At Electrify Chicago we want to showcase some of the best and worst performing
buildings in the city using publicly available data and manual annotations to add
building photographs and label multi-building owners like universities.
You can start by looking at Chicago's buildings with the highest greenhouse gas intensity - this means that they use the most energy when adjusted per unit of square foot, so big buildings could actually perform much better than very inefficient small buildings on this metric.
Chicago Buildings by Greenhouse Gas Intensity
Note: Data only includes large Chicago buildings from 2021, unless explicitly stated otherwise.
Note: This data only includes buildings whose emissions are reported
under the
Chicago Energy Benchmarking Ordinance. According to the City “As of 2016,
this list includes all commercial, institutional, and residential buildings larger than
50,000 square feet.” This dataset is also then filtered to only buildings with
reported emissions > 1,000 metric tons CO2 equivalent.
This data is also from 2021, but when new benchmark data is available, we'll update the site.
| Property Name / address | Primary Property Type |
Greenhouse Gas Intensity (kg CO2 eq./sqft) |
Total Greenhouse Emissions (metric tons CO2 eq.) |
|---|---|---|---|
|
213 West Institute Place
213 W Institute Pl
| Office | 4.2 kg/sqft
Lowest 12%
| 659 tons
Lowest 39%
|
|
Joyce Kilmer Elementary School
6700 N Greenview Ave
| K-12 School | 4.2 kg/sqft
Lowest 12%
| 447 tons
Lowest 22%
|
|
Louis Nettelhorst Elementary School
3252 N Broadway Ave
| K-12 School | 4.2 kg/sqft
Lowest 12%
| 441 tons
Lowest 22%
|
|
The Residences at Hudson & Huron Condominium Association
451 W HURON ST
| Multifamily Housing | 4.2 kg/sqft
Lowest 12%
| 929 tons
Highest 48%
|
|
Museum Park Lofts
125 E 13th St
| Multifamily Housing | 4.2 kg/sqft
Lowest 12%
| 880 tons
Lowest 50%
|
|
4300 Marine Drive Condominium Association
4300 N MARINE DR
| Multifamily Housing | 4.2 kg/sqft
Lowest 12%
| 820 tons
Lowest 47%
|
|
7121 7125 N Paulina
🏆
7121 7125 N PAULINA ST
| Multifamily Housing | 4.2 kg/sqft
Lowest 12%
| 244 tons
Lowest 5%
|
|
The Mark
4260 N BROADWAY ST
| Multifamily Housing | 4.2 kg/sqft
Lowest 12%
| 229 tons
Lowest 4%
|
|
Heartbreak Loftominium Association
17 N LOOMIS ST
| Multifamily Housing | 4.2 kg/sqft
Lowest 12%
| 381 tons
Lowest 16%
|
|
The Lofts at the Vic Condominium Association
1001 W BELMONT AVE
| Multifamily Housing | 4.2 kg/sqft
Lowest 12%
| 321 tons
Lowest 11%
|
|
5000 South Cornell
5000 S CORNELL AVE
| Multifamily Housing | 4.2 kg/sqft
Lowest 12%
| 625 tons
Lowest 37%
|
|
Providence St Mel School
119 S Central Park Blvd
| K-12 School | 4.2 kg/sqft
Lowest 12%
| 782 tons
Lowest 46%
|
|
Inter-American Elementary Magnet School
851 W Waveland Ave
| K-12 School | 4.2 kg/sqft
Lowest 12%
| 461 tons
Lowest 23%
|
|
G & A Senior Residence at Eastgate Village
300 E 26TH ST
| Multifamily Housing | 4.2 kg/sqft
Lowest 12%
| 439 tons
Lowest 21%
|
|
No. 10 Urban Court Lofts
1040 W Adams St
| Multifamily Housing | 4.2 kg/sqft
Lowest 12%
| 1,643 tons
Highest 29%
|
Data Source:
Chicago Energy Benchmarking Data